BURRITO
A visualization tool for exploratory data analysis of metagenomic data
Uploading data to BURRITO
Taxonomic Data OptionsFunctional Data Options
Options for Sample Grouping
Visualization Settings
Interacting with BURRITO
Exporting Figures and Data from BURRITO
Citation and Contact
A web tool for interactive visualization of the links between taxonomic composition and function in microbiome datasets
Microbiome sequencing studies typically focus on two related but separate questions: 1) which microbial taxa are present, and 2) what genetic functions are present?
BURRITO is a visualization tool developed to facilitate exploration of both taxonomy and function in microbiome datasets. BURRITO can estimate function abundances from 16S rRNA OTU data, and displays species abundances, function abundances, and the share of each function that can be attributed to each species while simultaneously allowing interactive comparisons between different samples.
BURRITO is located at http://elbo-spice.cs.tau.ac.il/shiny/burrito/
Overview
BURRITO can visualize compositional microbiome data from amplicon sequencing or whole metagenome profiling studies. To generate a visualization, users select from various options when uploading data to the tool home page. Using the most basic option, BURRITO requires a dataset of taxonomic abundances across samples. If no other data are provided, this dataset must use 97% Greengenes OTUs as taxonomic IDs. Data can be supplied in other formats with supporting information in the form of either gene annotations for each taxon or taxon-specific functional abundances. Sample datasets are provided in the documentation.
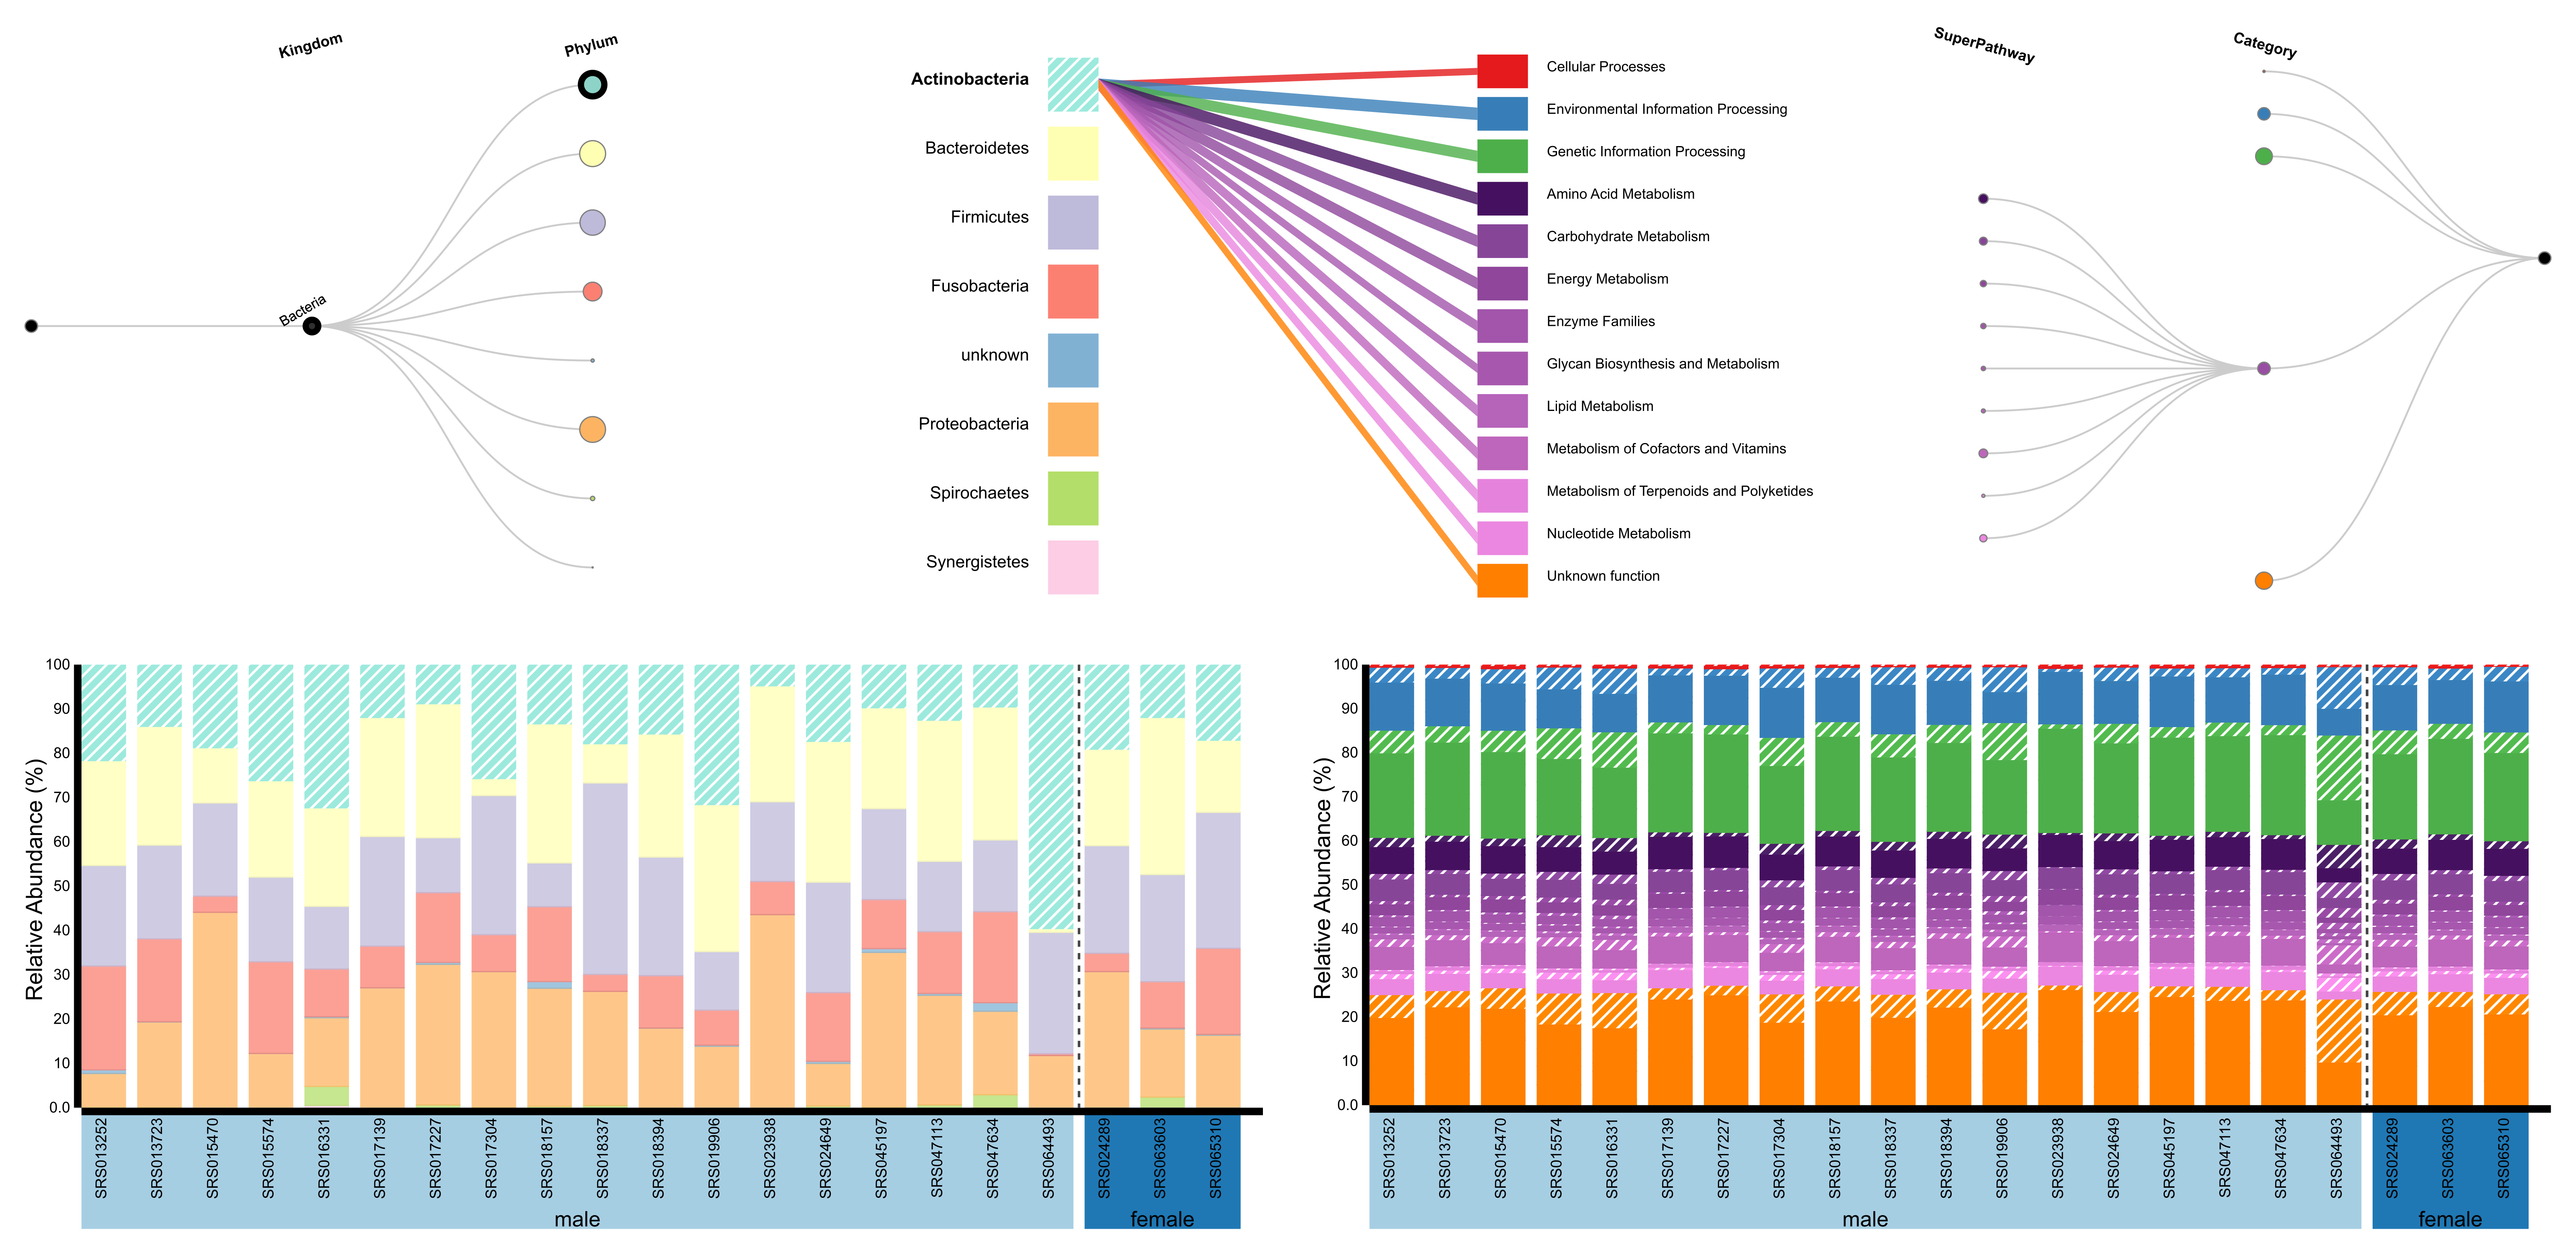
BURRITO uses the resulting taxonomic and taxonomy-linked functional dataset to generate a visualization combining standard stacked bar plots of the relative abundances of taxa and functions in each sample with a “control panel” that displays hierarchical and linking relationships and enables active exploration via these relationships. Optionally, BURRITO can display a second, taxa-independent functional stacked bar plot (e.g. from independent functional profile characterization such as metagenomic functional annotation) interleaved with the main taxonomy-based plot for comparison.
Users can interact with the visualization by placing the cursor over any item, which highlights all related components. Clicking on the different areas of the control panel allows for drilling down into specific subgroups of interest - nodes in the bipartite graph freeze the display of that node’s linked components. Try clicking on an edge in the control panel to see the abundance of a specific function attributable to a specific taxon. Clicking on a node of the trees will expand or collapse the level of detail.